Docs
Boards and dashboards
Overview for what to fix first, Threats for the attack picture, AppSec for the estate by project, Radar for how exposed you are right now, and your own dashboards from a widget library.
Overview
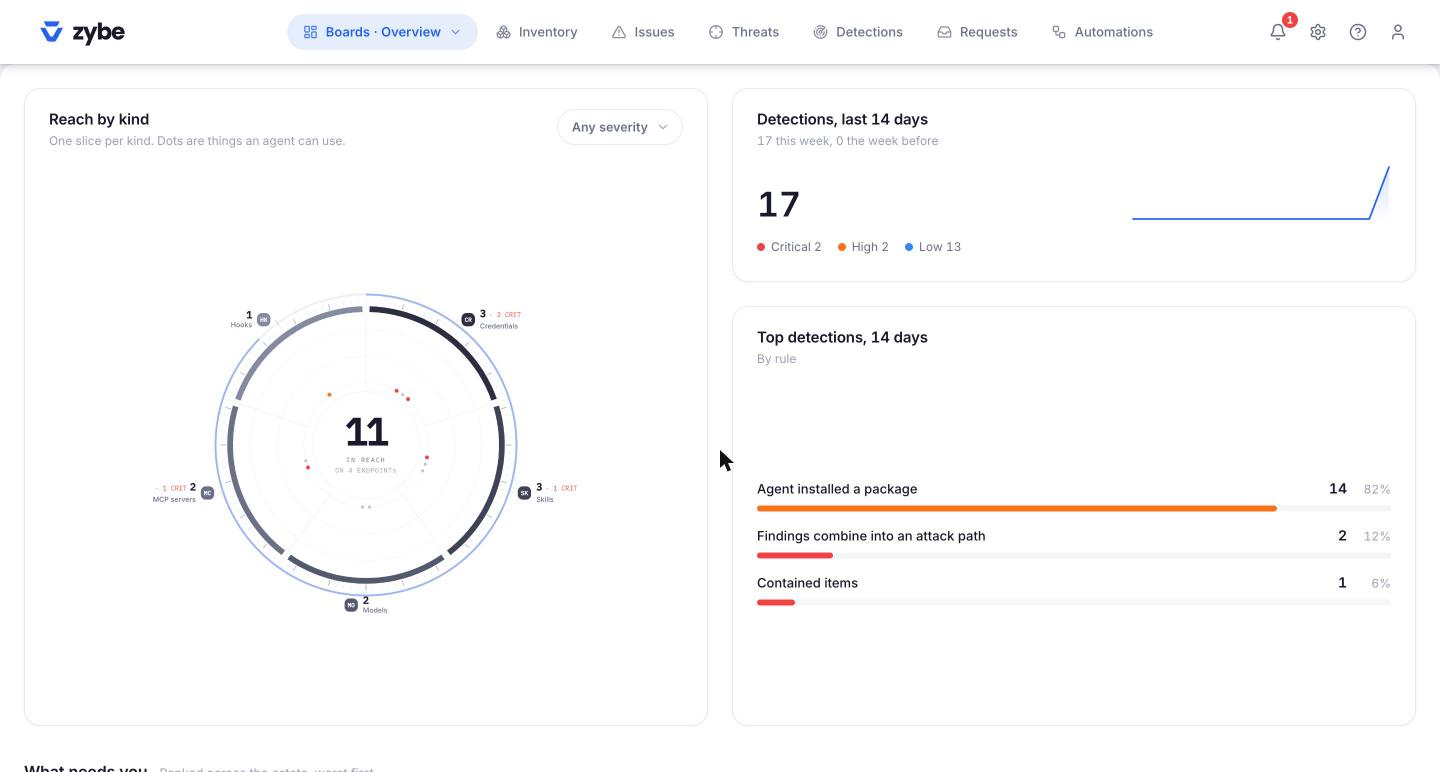
What to fix first, which AI tools carry the risk, the worst laptops, and a two-week trend. The reach wheel has one slice per kind of thing an AI tool can use, with the critical ones marked.
Threats
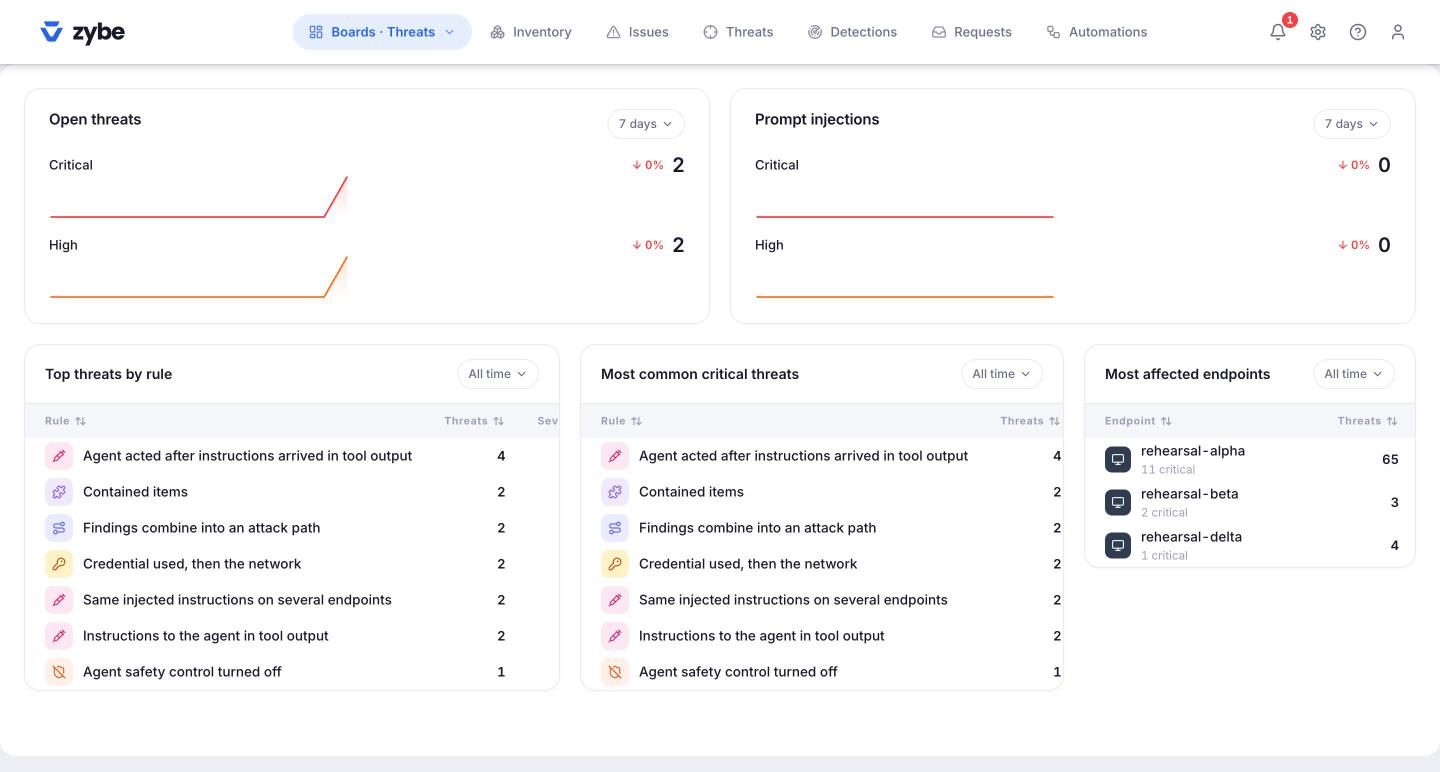
The attack picture over time: injections, secrets in flight, where they land, and how a thousand events became ten threats.
AppSec
The estate by project, whether or not it's a git repository. The numbers at the top: projects, projects at risk, known exploited vulnerabilities, vulnerable dependencies, exposed secrets. Below:
- Remediation queue: each vulnerable dependency with how many projects pull it in. Fix it once, clear it everywhere.
- Secrets in code: credentials found in project files, and which projects.
- Security by project: worst first, with vulnerabilities, known exploited, secrets and detections per project. Click one for its drawer.
Radar
How exposed you are right now and whether it's getting better or worse.
- Agents, Live: one dot per AI session happening now, with its subagents, and a red ring on any with an open detection.
- Agents, Overview: the same grouped by tool.
- Endpoints: one dot per laptop, sized by how many AI tools it has, grouped by endpoint group or operating system. Hover for the owner, counts and the Risk score.
The risk score is 0 to 100. It adds up open issues and detections by severity, a little per AI tool, MCP server and readable credential, and a penalty if the laptop hasn't reported for half an hour. It's for ranking laptops against each other, not a grade.
Compliance
Seven frameworks assessed from what the laptops report. See Show it for an audit.
Your own dashboard
- Click Boards, then New dashboard.
- Name it. Click Add widgets and drag from the drawer, or click to add.
- Drag to reorder. Click Create dashboard.
Widgets: threats over time, by severity, top threats; issues by severity and by cause; critical and known-exploited vulnerabilities; standing permissions; secrets in reach; unreviewed skills and servers; endpoints at risk; compliance; what was prevented; token spend.
Your dashboards appear in the Boards menu under Custom. They're kept in your browser, so they're yours; a colleague makes their own.